Python Finance Package v0.03 – Date Utils, Lists Utils, Event Studies
Continuing with the Python Finance Package. This update took longer because I change my setup to Linux (elementaryos), also things are getting complicated/interesting as my finance knowledge is mostly null, so I am learning as I develop the package, that was part of the plan so no complains about that.
The objective was to solve the Computational Investing Homework 4. Using the current code on the package (EventFinder + MarketSimulator) is possible to solve the homework, but I will cover that on a later post.
Changes since last time
- Bug fixes on File Manager and Data Access
- Improved tests
- Added Date Utils and List Utils to manage the open dates from NYSE
- Added Event Studies
- (Single) Past Event
- Event Finder
- Multiple Events
Date Utils
- Returns the dates the market was open between two dates.
- Looks for the closer date on a list of dates and returns the index of that date on the list
def nyse_dates(start=datetime(2000,1,1), end=datetime.today(),
insideSearch=True, list=False,
lookbackDays=0, lookforwardDays=0)

def search_closer_date(date, dates, exact=False, searchBack=True,
maxDistance=10)
Example:
from datetime import datetime
from finance.utils import DateUtils

all_dates = DateUtils.nyse_dates(list=True)
print(all_dates)

print(DateUtils.nyse_dates(start=datetime(2008,1,1)))

index = DateUtils.search_closer_date(datetime(2009,1,1), all_dates)
print(index, all_dates[index])
Output:
[datetime.datetime(2000, 1, 3, 0, 0),
datetime.datetime(2000, 1, 4, 0, 0),
datetime.datetime(2000, 1, 5, 0, 0),
    ...
datetime.datetime(2012, 12, 21, 0, 0),
datetime.datetime(2012, 12, 24, 0, 0),
datetime.datetime(2012, 12, 26, 0, 0)]
# Note: Length: 3268

2008-01-02    2008-01-02 00:00:00
2008-01-03    2008-01-03 00:00:00
2008-01-04    2008-01-04 00:00:00
2008-01-07    2008-01-07 00:00:00
    ...
2012-12-20    2012-12-20 00:00:00
2012-12-21    2012-12-21 00:00:00
2012-12-24    2012-12-24 00:00:00
2012-12-26    2012-12-26 00:00:00
Length: 1258

2262 2008-12-31 00:00:00
# Note 2009-1-1 was not open, closer date looking back is 2008-12-31
List Utils
- Date Utils extends the List Utils of dates which only returns all the NYSE dates
- List Utils also provides the symbols from S&P500 each year
Example:
from finance.utils import ListUtils

sp500_2012 = ListUtils.SP500(year=2012)
print(len(sp500_2012), sp500_2012)
Output:
501 ['A', 'AA', 'AAPL', ... ,'YUM', 'ZION', 'ZMH']
Simple Past Event
Input: date of interest, equity to analyze, market symbol to compare, event window length (back and forward) and estimation period length.
Output: The program downloads the necessary information and analyse the event: expected return, abnormal return, cumulative abnormal return, t-test.
Example (same from: http://www.youtube.com/watch?v=FRNabkJ48vs):
from datetime import datetime
from finance.evtstudy import PastEvent
pevt = PastEvent('./data')
pevt.symbol = 'AAPL'
pevt.market = "\^gspc"
pevt.lookback_days = 10
pevt.lookforward_days = 10
pevt.estimation_period = 252
pevt.date = datetime(2009, 1, 5)
pevt.run()
# print(pevt.expected_return)
# print(pevt.abnormal_return)
print(pevt.cumulative_abnormal_return)
# print(pevt.t_test)
import matplotlib
matplotlib.use('Qt4Agg') # Probably most people dont need this line
import matplotlib.pyplot as plt
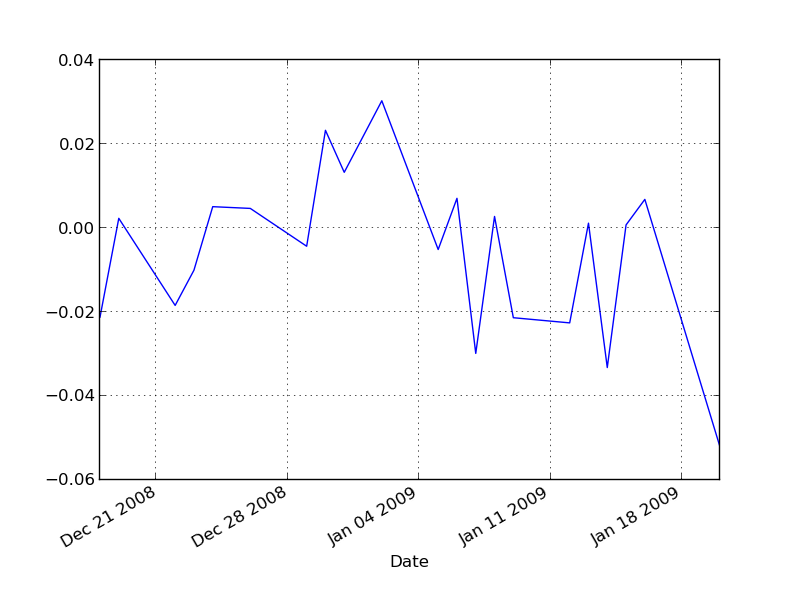
pevt.expected_return.plot()
plt.show()
Output:
Date
2008-12-18 0.024165
2008-12-19 0.028294
2008-12-22 -0.000580
2008-12-23 0.016884
...
2009-01-14 0.038178
2009-01-15 0.014626
2009-01-16 -0.004774
2009-01-20 -0.002890
Name: Cumulative Abnormal Return
# NOTE: Length: 21
Event Finder
Input: List of equities, date range to search for events, event_function [defaults: went_blow(amount), went_above(amount), increase(amount), decrease(amount)]
Output: Looks each equity on each date and creates an event matrix
Optional/Defaults:
- Loads/saves a cache (pickle) version of the data.
- By default only takes the first event on each equity
Example:
evtf = EventFinder('./data')
evtf.symbols = ['AMD', 'CBG']
evtf.start_date = datetime(2008, 1, 1)
evtf.end_date = datetime(2010, 12, 31)
evtf.function = evtf.went_below(3)
evtf.search()

print(evtf.num_events)
print(evtf.matrix)
Output:
2

            AMD  CBG
Date
2008-10-27    1  NaN
2009-02-27  NaN    1
Multiple Events
Input: Uses the matrix created on the Event Finder and analyse each event
Output:
- For each event
- Expected return
- Abnormal return
- Cumulative abnormal return
- Mean of:
- Expected returns
- Abnormal returns
- Cumulative abnormal returns
Example:
from datetime import datetime
from finance.evtstudy import EventFinder, MultipleEvents
evtf = EventFinder('./data')
evtf.symbols = ['AMD', 'CBG']
evtf.start_date = datetime(2008, 1, 1)
evtf.end_date = datetime(2009, 12, 31)
evtf.function = evtf.went_below(3)
evtf.search()
mevt = MultipleEvents('./data')
mevt.matrix = evtf.matrix
mevt.market = 'SPY'
mevt.lookback_days = 20
mevt.lookforward_days = 20
mevt.estimation_period = 200
mevt.run()
print(mevt.mean_abnormal_return)
import matplotlib
matplotlib.use('Qt4Agg') # Probably most people dont need this line
import matplotlib.pyplot as plt
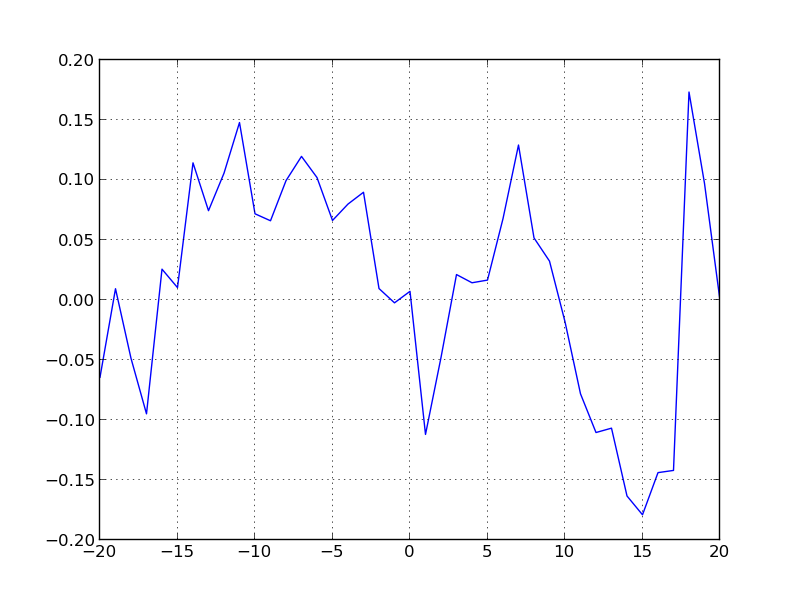
mevt.mean_cumulative_abnormal_return.plot()
plt.show()
Output:
    -20   -0.064385
    -19    0.073792
     ...
    -1    -0.011918
     0     0.009591
     1    -0.119249
     ...
     19   -0.076149
     20   -0.097525
Conclusion
As usual the code is on github: PythonFinance
What is next? A more real-life example using ipython